


In high-stakes engineering applications like battery fault detection, precision is everything. But how do you consistently achieve it? The confusion matrix holds the key.
In this blog, we’ll explore how this essential tool can sharpen your model’s accuracy and guide you toward data-driven decisions that boost business outcomes. Ready to elevate your predictive performance? Let’s get started.
The confusion matrix – What is it?
A confusion matrix is a simple yet powerful tool used to evaluate the performance of a classification model. In its most basic form (binary classification), the matrix is a 2x2 table comparing actual and predicted outcomes:
| Predicted Positive | Predicted Negative | |
|
Actual Positive |
True Positive (TP) |
False Negative (FN) |
|
Actual Negative |
False Positive (FP) |
True Negative (TN) |
The confusion matrix gives a detailed breakdown of your model's performance. It shows the number of true positives (correctly predicted positive cases), true negatives (correctly predicted negative cases), false positives, and false negatives.
Why you need to understand the confusion matrix
Confusion matrices are vital in various fields where classification problems are common. For example:
- Fault detection in engineering (e.g., predicting whether a battery is faulty or functional).
- Quality assurance systems (e.g., classifying whether a product passes or fails testing).
- Healthcare diagnostics (e.g., identifying whether a patient has a particular disease).
The confusion matrix is crucial as it offers a more comprehensive insight into model performance beyond accuracy. It identifies potential areas where the model might not perform well, like incorrectly identifying faulty batteries as functional (false negatives), which could have severe implications in industrial environments.
The confusion matrix in practice: examining where the trade-offs lie

To better illustrate the importance of the confusion matrix, let’s consider a fictional project where a company is building a battery fault detection system.
Stage 1: Defining the problem
The company faces a fundamental challenge: predicting battery failures before they reach customers. With historical data on battery performance and failures, the engineering team sets out to develop a classification model. Employees know that faulty batteries could lead to costly recalls and harm the company’s reputation, so building an accurate model is essential. They also understand the importance of balancing over-predicting (false positives) and under-predicting (false negatives). Both come with trade-offs, and the team must carefully navigate these decisions.
Stage 2: Model development
The team developed an initial model with a promising 90% accuracy that they were optimistic about. However, upon reviewing the confusion matrix, they discovered a critical issue: while the model accurately identifies functioning batteries, it misses 30% of the faulty ones (false negatives). Missing faulty batteries could lead to severe consequences for the business. The team realises that accuracy alone isn’t enough—they need to dive deeper into the model’s performance.
Stage 3: Evaluating trade-offs
After examining the confusion matrix, the team discusses the trade-offs between false positives and false negatives. False negatives—missing faulty batteries—pose a greater risk to the business than false positives, which would flag good batteries for further inspection. The team debates how much of an increase in false positives they can tolerate to reduce false negatives. They adjust the classification threshold, understanding that catching more faulty batteries is the priority, even if some functioning batteries are wrongly flagged.
Stage 4: Model refinement
The team retrains the model with the adjusted threshold, focusing on reducing false negatives. After further testing and evaluation, they see a significant improvement: the false negatives drop and the model is better at identifying faulty batteries. Though this leads to an increase in false positives, the team agrees that this is an acceptable trade-off, as it’s easier to inspect flagged batteries than to risk the brand impact and service costs of sending faulty products to customers. They are more confident in the model’s reliability.
Stage 5: Trusting the model and reaping the benefits
With the refined model in place, the company starts screening batteries before shipping. The confusion matrix is critical in helping the team trust that the model strikes the right balance between false positives and false negatives. Now, the company benefits from fewer faulty batteries making it through the system, significantly reducing the risk of recalls. The slight increase in false positives leads to a manageable number of extra inspections, which the team accepts as part of the process. Overall, the model improves operational efficiency, quality control, and customer satisfaction, while protecting the company from the financial and reputational damage of faulty products.

Understanding the model
When you input data into a classification model, it assigns a class label (e.g., "faulty" or "functional" for batteries). The confusion matrix then compares these predicted labels with the actual labels to help you gain insights into the following:
- True Positives (TP): The model correctly predicted a faulty battery.
- False Positives (FP): The model incorrectly predicted a functional battery as faulty.
- True Negatives (TN): The model correctly predicted a functional battery.
- False Negatives (FN): The model incorrectly predicted a defective battery as functional.
The matrix summarises these results, helping you assess whether the model is over- or under-predicting specific outcomes.
Understanding predictions and their business impact
When applied to real-world engineering problems, classification models have significant implications for business:
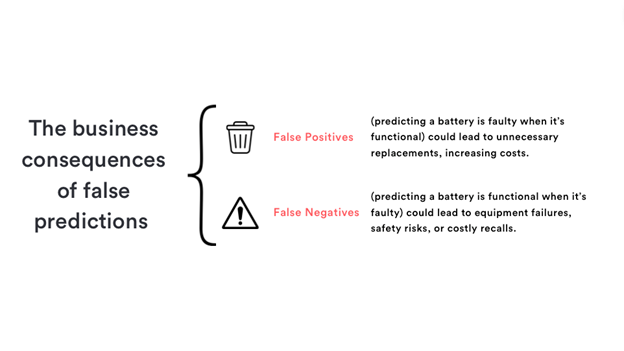
- False positives: Incorrectly predicting a faulty battery results in unnecessary replacements, increasing costs.
- False negatives: Allowing a faulty battery to pass as functional can significantly impact the customers receiving them, such as equipment failures, safety risks, or costly recalls.
Neither of these scenarios is desirable, but depending on your business application, one may be more favourable than the other. For instance, a company making low-cost but safety-critical O-rings may optimise the model to catch more defects at the expense of throwing away “good” O-rings.
On the other hand, a company making high-cost decorative trim equipment for luxury cars may prefer to reduce wasted components at the expense of letting a few defects pass to be sorted later downstream.
By analysing the confusion matrix, engineers can better understand the trade-offs and optimise models to reduce business risks.
Understanding how to fine-tune the model
Once you've analysed your confusion matrix, the next step is model fine-tuning. This often involves adjusting the model’s classification threshold to prioritise specific metrics (e.g., precision or recall).
- Precision is essential when you want to reduce false positives.
- Recall is vital to catch as many positives as possible, even if it means more false positives.
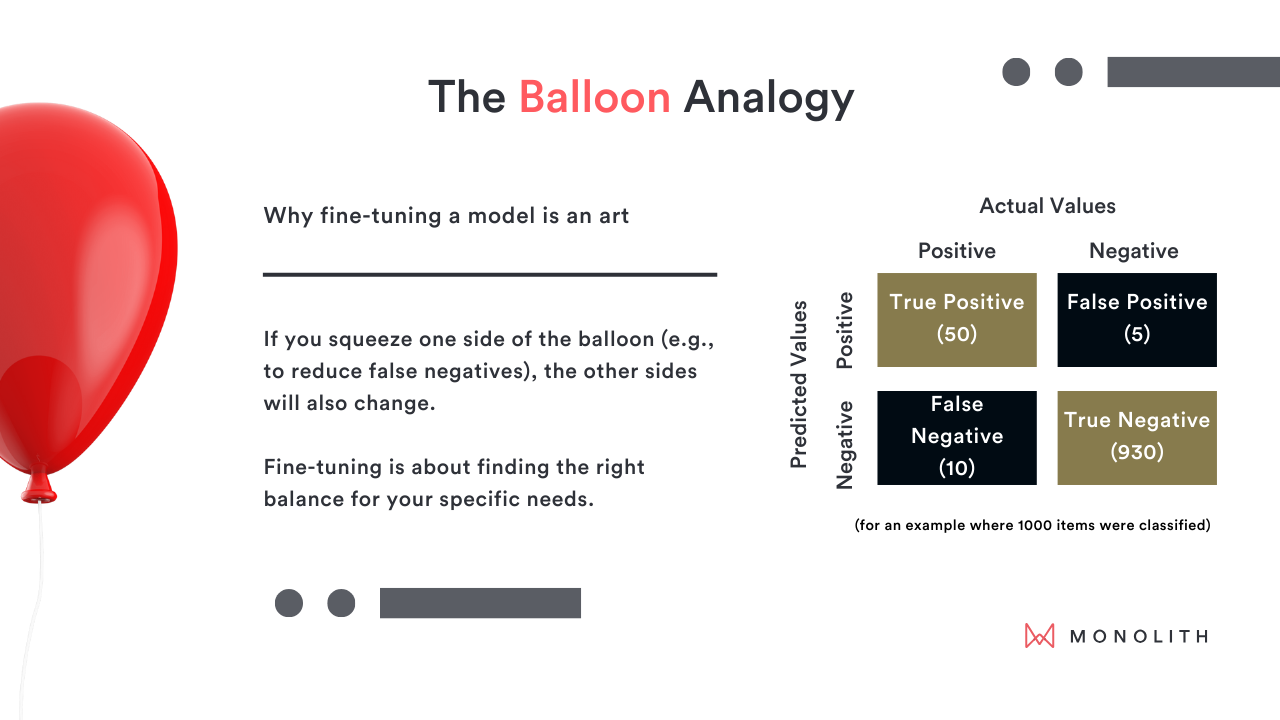
Imagine your confusion matrix as a balloon. If you squeeze one side of the balloon (e.g., to reduce false negatives), the other side (e.g., false positives) expands. Fine-tuning is about finding the right balance for your specific needs.
Common issues with the confusion matrix
Despite its usefulness, the confusion matrix can be misunderstood or misused. Common issues include:
- Over-reliance on accuracy: Accuracy doesn’t tell the whole story, especially with imbalanced datasets where one class dominates.
- Imbalanced datasets: If your dataset has many more examples of one class than the other, accuracy alone can be misleading. For example, predicting that all batteries are functional might give you high accuracy, but it’s useless if faulty batteries go undetected.
- Threshold choices: Small changes in your decision threshold can drastically affect the confusion matrix, and this needs careful consideration.
Description of important terms
Here are a few key terms that come up when discussing confusion matrices:
- Precision: The proportion of predicted positives that were positive.
Formula:
Precision=TP / (TP + FP)
- Recall (Sensitivity): The proportion of actual positives that were correctly predicted.
Formula:
Recall=TP/ (TP+FN )
- F1 Score: The harmonic mean of precision and recall, providing a balance between the two.
Formula:
F1 Score= 2 / ((1/ Recall )+ (1/Precision))
- Specificity: The proportion of actual negatives that were correctly predicted.
Formula:
Specificity=TN / (TN+FP )
Why these metrics matter
It's essential to grasp these metrics to make well-informed business decisions. For instance, having a high recall is vital in fault detection systems where overlooking a faulty component (false negative) could result in equipment failure.
On the other hand, high precision may be more critical when unnecessary interventions (false positives) are expensive.


Where to go next?
The confusion matrix is a powerful tool with broad applications in engineering, from fault detection to performance optimisation. As we’ve seen, its potential goes beyond a single use case—its impact on model tuning and decision-making is vast.
This blog only scratches the surface of what’s possible. Stay tuned for future discussions where we’ll dive deeper into best practices, explore more advanced applications, and continue refining your approach to machine learning in engineering.
Want to learn more?
Ready to dive deeper? Download our Confusion Matrix Guide for a quick reference guide to the key metrics discussed in this post.
